Prometheus Operator Concepts: Difference between revisions
(Created page with "=Internal= * Prometheus Concepts =Custom Resources= ==Prometheus Resource== ==ServiceMonitor Resource==") |
|||
| (18 intermediate revisions by the same user not shown) | |||
| Line 1: | Line 1: | ||
=External= | |||
* https://github.com/prometheus-operator/prometheus-operator | |||
* https://github.com/prometheus-operator/prometheus-operator/blob/master/Documentation/api.md | |||
=Internal= | =Internal= | ||
* [[Prometheus_Concepts#Prometheus_Operator|Prometheus Concepts]] | * [[Prometheus_Concepts#Prometheus_Operator|Prometheus Concepts]] | ||
=Overview= | |||
The Operator decouples the deployment of Prometheus instances from the configuration of which [[Prometheus_Concepts#Target|targets]] they are monitoring. The Operator defines two custom resources: [[#Prometheus|Prometheus]] and [[#ServiceMonitor|ServiceMonitor]]. | |||
The Operator ensures that for each [[#Prometheus|Prometheus]] resource there is a set of Prometheus servers that are running with the correct configuration. The operator manages the servers' configuration, including persistent volume claims, number of replicas, the server version, the Alertmanager instances, the monitoring targets and their associated parameters. | |||
The monitoring targets and their parameters can be set manually, but the preferred option is to let the Operator generate the configuration based on declared [[#ServiceMonitor|ServiceMonitor]] instances. | |||
:::[[File: PrometheusOperator.png]] | |||
=Custom Resources= | =Custom Resources= | ||
==Prometheus Resource== | ==<span id='Prometheus'></span>Prometheus Resource== | ||
==ServiceMonitor Resource== | {{External|https://github.com/prometheus-operator/prometheus-operator/blob/master/Documentation/api.md#prometheus}} | ||
The Prometheus resource declares a "serviceMonitorSelector": | |||
<syntaxhighlight lang='yaml'> | |||
apiVersion: monitoring.coreos.com/v1 | |||
kind: Prometheus | |||
... | |||
spec: | |||
serviceMonitorSelector: | |||
matchLabels: | |||
release: prometheus | |||
</syntaxhighlight> | |||
==<span id='ServiceMonitor'></span>ServiceMonitor Resource== | |||
{{External|https://github.com/prometheus-operator/prometheus-operator/blob/master/Documentation/api.md#servicemonitor}} | |||
A ServiceMonitor is a custom resource that can be used to specify a monitoring target to the Prometheus server. The ServiceMonitor describes how metrics can be retrieved from a set of [[Kubernetes_Service_Concepts#Service_.28ClusterIP_Service.29|Services]] exposing the monitoring targets' pods. The [[#Prometheus_Resource|Prometheus]] instance is associated with the ServiceMonitors by labels: the ServiceMonitor instance must match [[#Prometheus_Resource|Prometheus]] serviceMonitorSelector. The Operator configures the Prometheus server instances to monitor all Services that match the included ServiceMonitors and keeps this configuration synchronized with any changes happening in the cluster. The Services are associated with their ServiceMonitors with labels | |||
===ServiceMonitor Manifest=== | |||
<syntaxhighlight lang='yaml'> | |||
apiVersion: monitoring.coreos.com/v1 | |||
kind: ServiceMonitor | |||
metadata: | |||
name: example | |||
labels: | |||
# ServiceMonitor's labels must match Prometheus instance serviceMonitorSelector | |||
release: prometheus | |||
spec: | |||
endpoints: | |||
- path: /metrics | |||
port: "9091" | |||
namespaceSelector: | |||
matchNames: | |||
- prometheus | |||
# ServiceMonitor's selector identifies matching Services | |||
selector: | |||
matchLabels: | |||
function: monitoring-target-1 | |||
</syntaxhighlight> | |||
===ServiceMonitor Operations=== | |||
The current service monitor list can be obtained with: | |||
<syntaxhighlight lang='bash'> | |||
kubectl -n <namespace> get servicemonitors | |||
</syntaxhighlight> | |||
=Configuring Prometheus with Prometheus Operator= | |||
{{Internal|Configuring Prometheus with Prometheus Operator|Configuring Prometheus with Prometheus Operator}} | |||
Latest revision as of 00:36, 15 October 2020
External
- https://github.com/prometheus-operator/prometheus-operator
- https://github.com/prometheus-operator/prometheus-operator/blob/master/Documentation/api.md
Internal
Overview
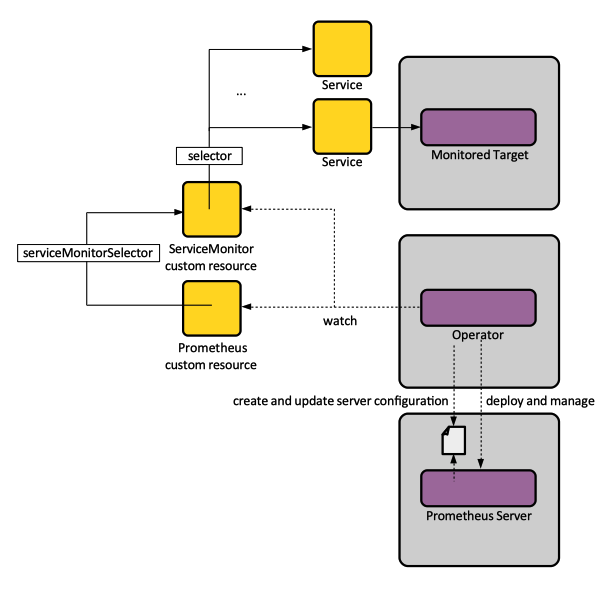
The Operator decouples the deployment of Prometheus instances from the configuration of which targets they are monitoring. The Operator defines two custom resources: Prometheus and ServiceMonitor.
The Operator ensures that for each Prometheus resource there is a set of Prometheus servers that are running with the correct configuration. The operator manages the servers' configuration, including persistent volume claims, number of replicas, the server version, the Alertmanager instances, the monitoring targets and their associated parameters.
The monitoring targets and their parameters can be set manually, but the preferred option is to let the Operator generate the configuration based on declared ServiceMonitor instances.
Custom Resources
Prometheus Resource
The Prometheus resource declares a "serviceMonitorSelector":
apiVersion: monitoring.coreos.com/v1
kind: Prometheus
...
spec:
  serviceMonitorSelector:
    matchLabels:
      release: prometheus
ServiceMonitor Resource
A ServiceMonitor is a custom resource that can be used to specify a monitoring target to the Prometheus server. The ServiceMonitor describes how metrics can be retrieved from a set of Services exposing the monitoring targets' pods. The Prometheus instance is associated with the ServiceMonitors by labels: the ServiceMonitor instance must match Prometheus serviceMonitorSelector. The Operator configures the Prometheus server instances to monitor all Services that match the included ServiceMonitors and keeps this configuration synchronized with any changes happening in the cluster. The Services are associated with their ServiceMonitors with labels
ServiceMonitor Manifest
apiVersion: monitoring.coreos.com/v1
kind: ServiceMonitor
metadata:
  name: example
  labels:
    # ServiceMonitor's labels must match Prometheus instance  serviceMonitorSelector
    release: prometheus
spec:
  endpoints:
  - path: /metrics
    port: "9091"
  namespaceSelector:
    matchNames:
    - prometheus
  # ServiceMonitor's selector identifies matching Services
  selector:
    matchLabels:
      function: monitoring-target-1
ServiceMonitor Operations
The current service monitor list can be obtained with:
kubectl -n <namespace> get servicemonitors
