Prometheus Adapter for Kubernetes Metrics APIs: Difference between revisions
Jump to navigation
Jump to search
| Line 83: | Line 83: | ||
* https://github.com/prometheus-community/helm-charts/tree/main/charts/prometheus-adapter#configuration | * https://github.com/prometheus-community/helm-charts/tree/main/charts/prometheus-adapter#configuration | ||
* https://github.com/DirectXMan12/k8s-prometheus-adapter/blob/master/docs/config.md | * https://github.com/DirectXMan12/k8s-prometheus-adapter/blob/master/docs/config.md | ||
* Default configuration: https://github.com/DirectXMan12/k8s-prometheus-adapter/blob/master/deploy/manifests/custom-metrics-config-map.yaml | * Default configuration: https://github.com/DirectXMan12/k8s-prometheus-adapter/blob/master/deploy/manifests/custom-metrics-config-map.yaml | ||
* Basics of setting the Prometheus Adapter walkthrough: https://github.com/DirectXMan12/k8s-prometheus-adapter/blob/master/docs/walkthrough.md | |||
=Troubleshooting= | =Troubleshooting= | ||
tail the logs, Prometheus connection refused is reported there. | tail the logs, Prometheus connection refused is reported there. | ||
Revision as of 04:16, 15 October 2020
External
- https://github.com/DirectXMan12/k8s-prometheus-adapter
- https://github.com/prometheus-community/helm-charts/tree/main/charts/prometheus-adapter
Internal
Overview
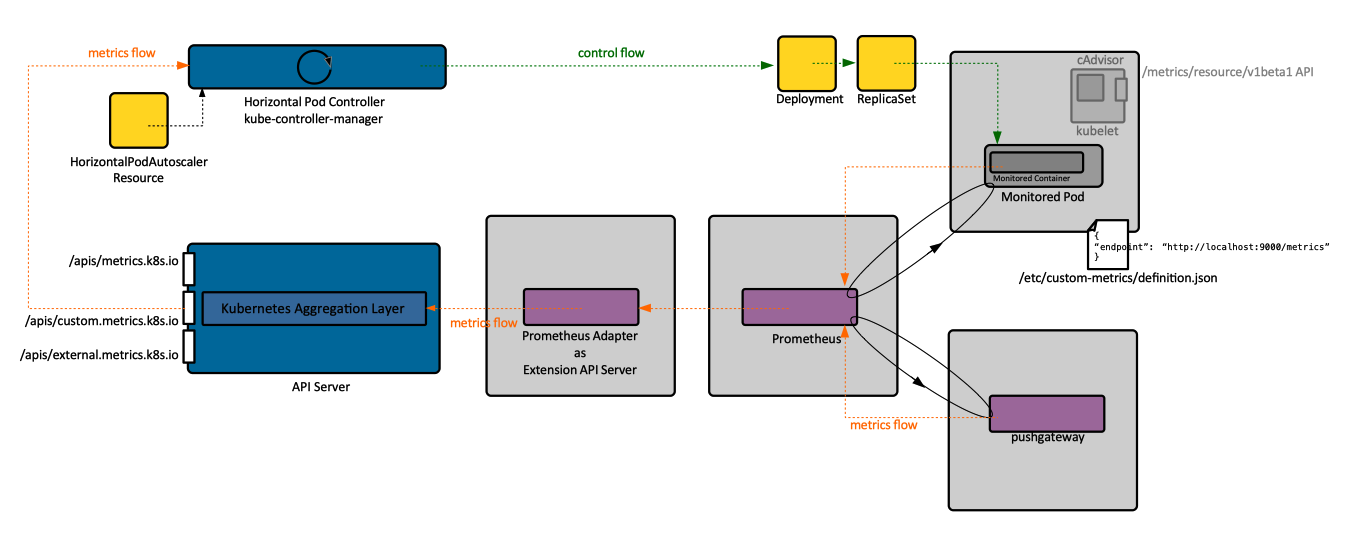
The Prometheus adapter is a Kubernetes Aggregation Layer extension and operates as an extension API server. It knows how to communicate with both Kubernetes and Prometheus, acting as a translator between the two. The API is registered as "custom.metrics.k8s.io/v1beta1".
Helm Installation
The adapter will be installed in the same namespace as Prometheus.
helm repo add prometheus-community https://prometheus-community.github.io/helm-charts
helm search repo prometheus-community
helm install -n prom prometheus-adapter prometheus-community/prometheus-adapter -f ./prometheus-adapter-overlay.yaml
See Configuration below for prometheus-adapter-overlay.yaml.
Test installation:
kubectl get --raw /apis/custom.metrics.k8s.io/v1beta1 | jq
{
  "kind": "APIResourceList",
  "apiVersion": "v1",
  "groupVersion": "custom.metrics.k8s.io/v1beta1",
  "resources": [
    {
      "name": "jobs.batch/kubernetes_build_info",
      "singularName": "",
      "namespaced": true,
      "kind": "MetricValueList",
      "verbs": [
        "get"
      ]
    },
    {
      "name": "services/kube_deployment_spec_strategy_rollingupdate_max_surge",
      "singularName": "",
      "namespaced": true,
      "kind": "MetricValueList",
      "verbs": [
        "get"
      ]
    },
   ...
}
Configuration
Use the following prometheus-adapter-overlay.yaml:
helm show values prometheus-community/prometheus-adapter > ~/tmp/prometheus-adapter-overlay.yaml
prometheus:
  url: http://prometheus-kube-prometheus-prometheus.prom.svc
Increase log level when installing the chart.
Test:
kubectl get --raw "/apis/custom.metrics.k8s.io/v1beta1/namespaces/default/pods/*/http_requests?selector=app%3Dsample-app"
Configuration Resources:
- https://github.com/prometheus-community/helm-charts/tree/main/charts/prometheus-adapter#configuration
- https://github.com/DirectXMan12/k8s-prometheus-adapter/blob/master/docs/config.md
- Default configuration: https://github.com/DirectXMan12/k8s-prometheus-adapter/blob/master/deploy/manifests/custom-metrics-config-map.yaml
- Basics of setting the Prometheus Adapter walkthrough: https://github.com/DirectXMan12/k8s-prometheus-adapter/blob/master/docs/walkthrough.md
Troubleshooting
tail the logs, Prometheus connection refused is reported there.
