Prometheus Adapter for Kubernetes Metrics APIs: Difference between revisions
| Line 13: | Line 13: | ||
=How it Works= | =How it Works= | ||
The adapter processes the metrics coming from Prometheus as follows: | |||
Discovery: it discovers available metrics. | |||
Association: it determines which kubernetes resource each metric is associated with. | |||
Naming: it determines how it should expose the metrics in the custom metric API. | |||
Querying: Finally, it figures out how it should query Prometheus to get the actual numbers. | |||
The adapter performs each of the steps for each metric. | |||
=Helm Installation= | =Helm Installation= | ||
Revision as of 04:27, 15 October 2020
External
- https://github.com/DirectXMan12/k8s-prometheus-adapter
- https://github.com/prometheus-community/helm-charts/tree/main/charts/prometheus-adapter
Internal
Overview
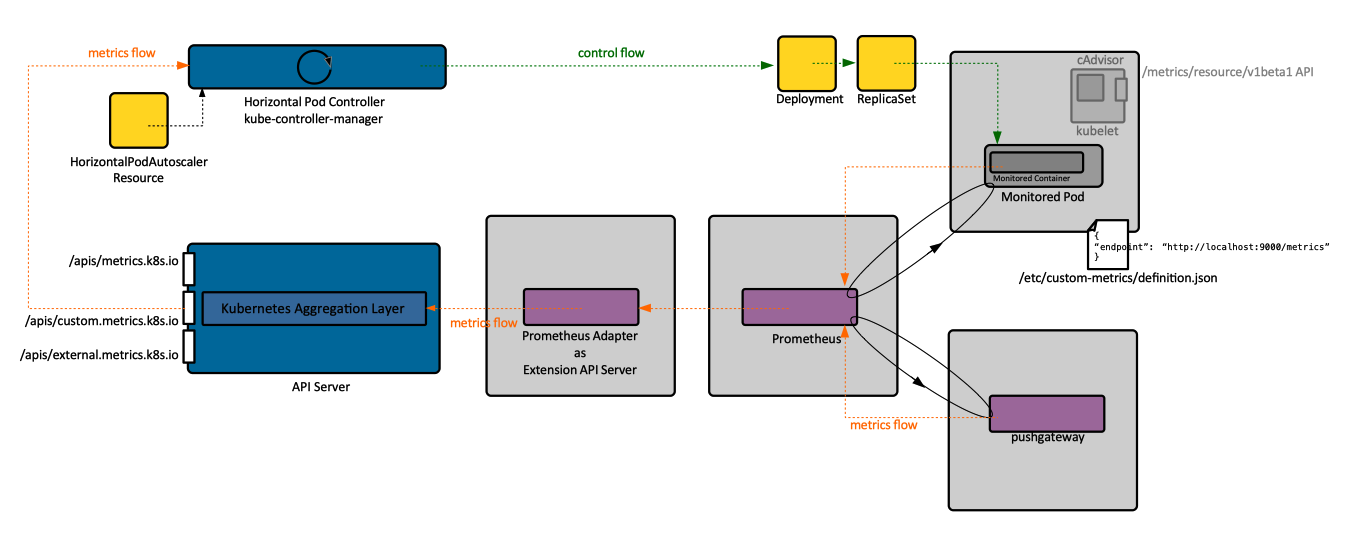
The Prometheus adapter is a Kubernetes Aggregation Layer extension and operates as an extension API server. It knows how to communicate with both Kubernetes and Prometheus, acting as a translator between the two. The API is registered as "custom.metrics.k8s.io/v1beta1".
How it Works
The adapter processes the metrics coming from Prometheus as follows:
Discovery: it discovers available metrics.
Association: it determines which kubernetes resource each metric is associated with.
Naming: it determines how it should expose the metrics in the custom metric API.
Querying: Finally, it figures out how it should query Prometheus to get the actual numbers.
The adapter performs each of the steps for each metric.
Helm Installation
The adapter will be installed in the same namespace as Prometheus.
helm repo add prometheus-community https://prometheus-community.github.io/helm-charts
helm search repo prometheus-community
helm install -n prom prometheus-adapter prometheus-community/prometheus-adapter -f ./prometheus-adapter-overlay.yaml
See Configuration below for prometheus-adapter-overlay.yaml.
Test installation:
kubectl get --raw /apis/custom.metrics.k8s.io/v1beta1 | jq
{
  "kind": "APIResourceList",
  "apiVersion": "v1",
  "groupVersion": "custom.metrics.k8s.io/v1beta1",
  "resources": [
    {
      "name": "jobs.batch/kubernetes_build_info",
      "singularName": "",
      "namespaced": true,
      "kind": "MetricValueList",
      "verbs": [
        "get"
      ]
    },
    {
      "name": "services/kube_deployment_spec_strategy_rollingupdate_max_surge",
      "singularName": "",
      "namespaced": true,
      "kind": "MetricValueList",
      "verbs": [
        "get"
      ]
    },
   ...
}
Configuration
Use the following prometheus-adapter-overlay.yaml:
helm show values prometheus-community/prometheus-adapter > ~/tmp/prometheus-adapter-overlay.yaml
prometheus:
  url: http://prometheus-kube-prometheus-prometheus.prom.svc
Increase log level when installing the chart.
Test:
kubectl get --raw "/apis/custom.metrics.k8s.io/v1beta1/namespaces/default/pods/*/http_requests?selector=app%3Dsample-app"
Configuration Resources:
- Configuration Reference: https://github.com/DirectXMan12/k8s-prometheus-adapter/blob/master/docs/config.md
- Basics of setting the Prometheus Adapter walkthrough (the full walkthrough): https://github.com/DirectXMan12/k8s-prometheus-adapter/blob/master/docs/walkthrough.md
- Configuration walkthrough: https://github.com/DirectXMan12/k8s-prometheus-adapter/blob/master/docs/config-walkthrough.md
- Default configuration: https://github.com/DirectXMan12/k8s-prometheus-adapter/blob/master/deploy/manifests/custom-metrics-config-map.yaml
- Chart README configuration section: https://github.com/prometheus-community/helm-charts/tree/main/charts/prometheus-adapter#configuration
Troubleshooting
tail the logs, Prometheus connection refused is reported there.
