Prometheus Adapter for Kubernetes Metrics APIs: Difference between revisions
| Line 129: | Line 129: | ||
<syntaxhighlight lang='yaml'> | <syntaxhighlight lang='yaml'> | ||
prometheus: | prometheus: | ||
url: http://prometheus-kube-prometheus-prometheus. | url: http://prometheus-kube-prometheus-prometheus.prometheus.svc | ||
rules: | |||
external: [] | |||
custom: | |||
- seriesQuery: 'synthetic_service_metric{exported_namespace="default",exported_service="synthetic-service"}' | |||
resources: | |||
overrides: | |||
exported_service: {resource: "service"} | |||
exported_namespace: {resource: "namespace"} | |||
name: | |||
as: 'synthetic_service_metric' | |||
metricsQuery: 'synthetic_service_metric{exported_namespace="default",exported_service="synthetic-service"}' | |||
</syntaxhighlight> | </syntaxhighlight> | ||
Increase log level when installing the chart. | Increase log level when installing the chart. | ||
==Configuration Resources== | ==Configuration Resources== | ||
* Configuration Reference: https://github.com/DirectXMan12/k8s-prometheus-adapter/blob/master/docs/config.md | * Configuration Reference: https://github.com/DirectXMan12/k8s-prometheus-adapter/blob/master/docs/config.md | ||
Revision as of 06:52, 16 October 2020
External
- https://github.com/DirectXMan12/k8s-prometheus-adapter
- https://github.com/prometheus-community/helm-charts/tree/main/charts/prometheus-adapter
Internal
Overview
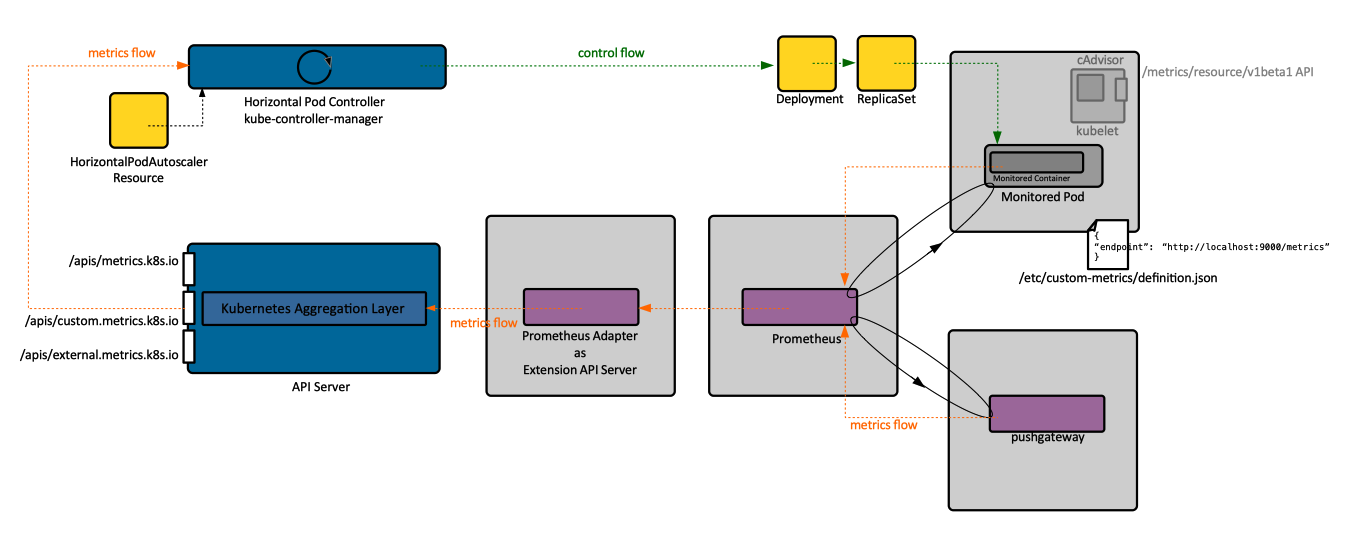
The Prometheus adapter is a Kubernetes Aggregation Layer extension and operates as an extension API server. It knows how to communicate with both Kubernetes and Prometheus, acting as a translator between the two. The API is registered as "custom.metrics.k8s.io/v1beta1".
How it Works
The adapter processes the metrics coming from Prometheus as follows:
Discovery: it discovers available metrics.
Association: it determines which kubernetes resource each metric is associated with.
Naming: it determines how it should expose the metrics in the custom metric API.
Querying: Finally, it figures out how it should query Prometheus to get the actual numbers.
The adapter performs each of the steps for each metric. These steps are formally described for each metric with a rule:
rules:
  - {...}
  - {...}
The discovery step is defined by a "seriesQuery", which is a query that returns a metric series definition (not numbers).
rules:
  - seriesQuery: 'http_requests_total{kubernetes_namespace!="",kubernetes_pod_name!=""}'
The association step maps labels to known resources. It is introduced by the "resources" keyword, followed by an "overrides" map, where labels are mapped to known resources.
rules:
  - seriesQuery: 'http_requests_total{kubernetes_namespace!="",kubernetes_pod_name!=""}'
    resources:
      overrides:
        kubernetes_namespace: {resource: "namespace"}
        kubernetes_pod_name: {resource: "pod"}
This says that each label represents its corresponding resource. For resources in the "core" kubernetes API the group does not need to be specified. The adapter will handle pluralization, "pod" is equivalent with "pods". The resources can be any resource available in your kubernetes cluster, as long as you've got a corresponding label.
If labels follow a consistent pattern, like "kubernetes_<resource>", the mapping can be done with an expression similar to:
resources: {template: "kubernetes_<<.Resource>>"}
instead of using an overrides map. The list of resources, including the custom resources, is provided by kubectl api-resources.
The name of the metric can be changed with a "name" translation rule:
rules:
  - ...
    name:
      matches: "^(.*)_total"
      as: "${1}_per_second"
The last part is specifying the query that provides numeric values:
rules:
  - ...
    metricsQuery: 'sum(rate(<<.Series>>{<<.LabelMatchers>>}[2m])) by (<<.GroupBy>>)'
Helm Installation
The adapter will be installed in the same namespace as Prometheus.
helm repo add prometheus-community https://prometheus-community.github.io/helm-charts
helm search repo prometheus-community
Prepare a minimal valid prometheus-adapter-overlay.yaml. An example is provided in the Minimal Valid Overlay section below.
Then install as follows:
helm install -n prom prometheus-adapter prometheus-community/prometheus-adapter -f ./prometheus-adapter-overlay.yaml
Test installation:
kubectl get --raw /apis/custom.metrics.k8s.io/v1beta1 | jq
{
  "kind": "APIResourceList",
  "apiVersion": "v1",
  "groupVersion": "custom.metrics.k8s.io/v1beta1",
  "resources": [
    {
      "name": "jobs.batch/kubernetes_build_info",
      "singularName": "",
      "namespaced": true,
      "kind": "MetricValueList",
      "verbs": [
        "get"
      ]
    },
    {
      "name": "services/kube_deployment_spec_strategy_rollingupdate_max_surge",
      "singularName": "",
      "namespaced": true,
      "kind": "MetricValueList",
      "verbs": [
        "get"
      ]
    },
   ...
}
Configuration
Use the following command to get a base for prometheus-adapter-overlay.yaml:
helm show values prometheus-community/prometheus-adapter > ~/tmp/prometheus-adapter-overlay.yaml
Minimal Valid Overlay
prometheus:
  url: http://prometheus-kube-prometheus-prometheus.prometheus.svc
rules:
  external: []
  custom:
    - seriesQuery: 'synthetic_service_metric{exported_namespace="default",exported_service="synthetic-service"}'
      resources:
        overrides:
          exported_service: {resource: "service"}
          exported_namespace: {resource: "namespace"}
      name:
        as: 'synthetic_service_metric'
      metricsQuery: 'synthetic_service_metric{exported_namespace="default",exported_service="synthetic-service"}'
Increase log level when installing the chart.
Configuration Resources
- Configuration Reference: https://github.com/DirectXMan12/k8s-prometheus-adapter/blob/master/docs/config.md
- Basics of setting the Prometheus Adapter walkthrough (the full walkthrough): https://github.com/DirectXMan12/k8s-prometheus-adapter/blob/master/docs/walkthrough.md
- Configuration walkthrough: https://github.com/DirectXMan12/k8s-prometheus-adapter/blob/master/docs/config-walkthrough.md
- Default configuration: https://github.com/DirectXMan12/k8s-prometheus-adapter/blob/master/deploy/manifests/custom-metrics-config-map.yaml
- Chart README configuration section: https://github.com/prometheus-community/helm-charts/tree/main/charts/prometheus-adapter#configuration
- Boilerplate guide: https://github.com/kubernetes-sigs/custom-metrics-apiserver/blob/master/docs/getting-started.md#kinds-resources-and-scopes
Troubleshooting
Tailing the logs is useful, Prometheus connection refused are reported there. Also, since the horizontal pod autoscaler will make the invocations into the metrics APIs, its logs are also useful, see Horizontal Pod Autoscaler Controller Troubleshooting.
To check what is the adapter exposing, execute:
kubectl get --raw "/apis/custom.metrics.k8s.io/v1beta1/"
kubectl get --raw /apis/custom.metrics.k8s.io/v1beta1 | jq '.resources[] | select(.name | contains("action_queue_depth"))'
kubectl get --raw /apis/custom.metrics.k8s.io/v1beta1/namespaces/default/ingresses.networking.k8s.io/synthetic/action_queue_depth
kubectl get --raw /apis/custom.metrics.k8s.io/v1beta1/namespaces/default/services/synthetic-service/synthetic_service_metric | jq
{
  "kind": "MetricValueList",
  "apiVersion": "custom.metrics.k8s.io/v1beta1",
  "metadata": {
    "selfLink": "/apis/custom.metrics.k8s.io/v1beta1/namespaces/default/services/synthetic-service/synthetic_service_metric"
  },
  "items": [
    {
      "describedObject": {
        "kind": "Service",
        "namespace": "default",
        "name": "synthetic-service",
        "apiVersion": "/v1"
      },
      "metricName": "synthetic_service_metric",
      "timestamp": "2020-10-15T22:17:13Z",
      "value": "3k",
      "selector": null
    }
  ]
}
