Java Memory Concepts
Internal
Heap
The heap is the runtime data area in the JVM where all class instances and arrays are allocated. The heap is allocated when the JVM starts, and it may be of a fixed or variable size. The objects that are no longer in use are automatically reclaimed by a garbage collector. Metrics reflecting heap usage are exposed by the Memory MBean, which can be obtained from the platform MBean server. The heap usually consists of several memory pools, depending on what garbage collector is in use:
Eden
Eden statistics are exposed by the "java.lang:type=MemoryPool,name=PS Eden Space" MemoryPool MBean.
Survivor Space
Survivor Space statistics are exposed by the "java.lang:type=MemoryPool,name=PS Survivor Space" MemoryPool MBean.
Old Generation
The Old (or Tenured) Generation is the area on the heap where objects instances that survive a certain number of new generation collections are promoted to, and stored. Once promoted to the Old Generation, the object instances are verified for reachability and possibly discarded if unreachable less often, depending on the specific garbage collection algorithm. Aside from algorithm-specific operations, all known garbage collection algorithms have the option to initiate a full garbage collection, when all the JVM threads are suspended, and the entire heap, including the Old Generation, is inspected for reachability and subsequently, unreachable objects are discarded. Objects that survive a full garbage collection have a good change to stay on the heap for the entire life time of the JVM. Memory leaks are caused by this kind of object instances.
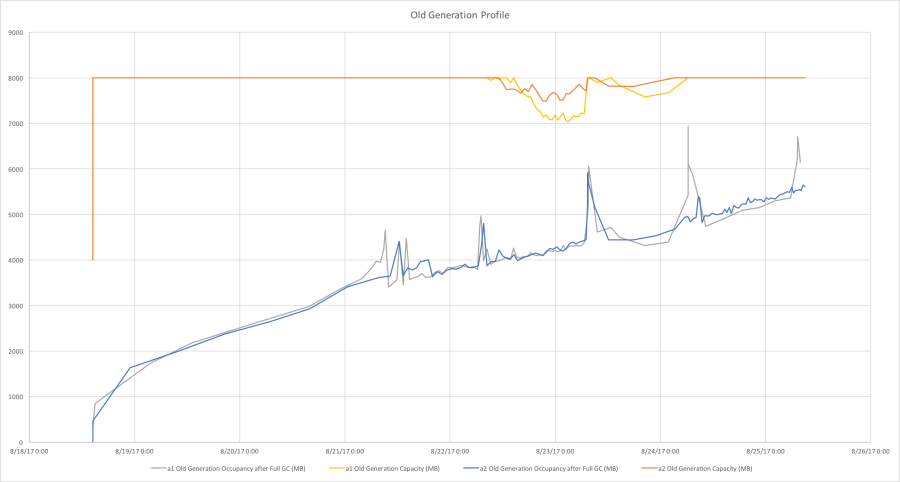
The following graph shows memory accumulating on the Old Generation during a long running test. The graph represents the Old Generation occupancy and capacity for two clustered JVMs (a1 and a2):
The size of the Old Generation cannot be set directly, but it is the difference between the size of the heap (-Xms/-Xmx) and the size of the new generation (-XX:NewSize/-XX:MaxNewSize). The actual size of the Old Generation is reported in the GC log on Full GC, if -XX:+PrintGCDetails is used:
2017-08-18T18:00:02.439-0400: 1900.971: [Full GC (Metadata GC Threshold) ... [ParOldGen: 725452K->870337K(8192000K)] ...
Old Generation statistics are exposed by the "java.lang:type=MemoryPool,name=PS Old Gen" MemoryPool MBean.
Non-Heap Memory
Anything else that is not a class instance or an array is allocated by the JVM in memory areas different from heap. These memory areas are referred collectively as non-heap memory. The non-heap memory include:
- "Metaspace" - a method area that stores per-class structures such as a runtime constant pool, per-class field and method definition data, and the code for method and constructors. The method area is shared among all threads. The method area is created at the JVM startup.
- "Code Cache" - an area where the JIT compiler stores native machine code translated from Java bytecode.
- "Compressed Class Space"
- a thread stack storage area. For more details, see the "Thread Stack Memory Management" section.
Memory Pool
A memory pool represents a memory area managed by the JVM, and it can belong either to the heap or the non-heap memory. A memory pool is managed by one or more memory managers. Statistics about specific memory pools are exposed by the corresponding Memory Pool MBean. Examples of memory pools:
- Eden (heap)
- Survivor Space (heap)
- Old Generation (heap)
Memory Manager
A memory manager is the JVM runtime component that manages one or more memory pools.
The garbage collectors are a type of memory manager.
Other non-heap memory managers:
- The CodeCache manager - manages the Code Cache memory pool.
- The Metaspace manager - manages the Metaspace memory pool.
The memory managers are exposed over JMX by MemoryManager MBeans and the Garbage Collector MBeans.
Runtime Constant Pool
Garbage Collector
A set of one or more memory managers responsible for reclaiming memory that is occupied by unreachable objects.
The parallel collector, for example, consists of two distinct memory managers:
- "Scavenge" memory manager, that interacts with the Eden and the Survivor Space memory pools.
- "Mark and Sweep" memory manager, that interacts with all three heap memory pools (Eden, Survivor Space and Old Generation).
Thread Stack Memory Management
The default thread stack size on 64-bit systems is 1024K. 64k is the least amount of stack space allowed per thread.
It can be modified with with the -Xss option:
java ... -Xss<size> ...
where "<size>" represents the amount of memory and the measure unit (ex "2048k").
Garbage Collection Operations
Full Garbage Collection
Reachability Scopes
Strongly Reachable
Weakly Reachable
Softly Reachable
Pending Finalization
Unreachable
HPROF Format
Java has built-in capability for dumping heap snapshots in the HPROF binary format. The dump file have usually the *.hprof extension. Various profilers may have the capability to capture heap dumps in extended format, that include additional troubleshooting information, as, for example, the YourKit memory snapshot format.
