YourKit Concepts
Internal
Profiler Agent
Remote Profiling
Remote profiling is the situation when the profiled application and the profiler UI run on different machines, and the profiler UI communicates with the profiler agent over the network. Remote profiling is only possible if the application JVM loads the profiler agent. There are two methods to load the profiler agent within the target JVM:
- Manual configuration: the target JVM is started with a configuration that loads the profiler agent. Starting the JVM with the agent is recommended, because attaching the agent to a running JVM has limitations in profiling functionality and is not always possible. The detailed procedure to configure a JVM for remote profiling is described here: Manually Configure Target JVM for Remote Profiling.
- The 'attach' technique: The profiler agent is loaded into a running JVM without restart, using the "attach" technique. For more details see https://www.yourkit.com/docs/java/help/attach_agent.jsp and https://www.yourkit.com/docs/java/help/attach_wizard.jsp.
Memory Profiling
YourKit can be used to diagnose several types of memory problems: elevated steady-state level, memory leaks and excessive garbage collection. The memory telemetry information is maintained in a circular buffer in the profiler agent's memory.
Memory Snapshot in YourKit Format
A memory snapshot represents the memory state of the profiled application at the moment the snapshot was captured. The snapshot contains information about all loaded classes, all existing object instances, the values of their primitive fields and arrays of primitive types, and references between objects. Optionally, a memory snapshot in YourKit format may contain information about object allocations. By default, YourKit capture memory snapshots in its own format. Optionally, memory snapshots can be captured in a HPROF format. The memory snapshot includes "garbage": objects unreachable from GC roots, but not yet collected, and object pending finalization.
When a memory snapshot is taken, the profiler agent automatically increments the object generation number and associates all object instances in that snapshot with the new object generation number. For more details on this process, see Memory Snapshots and Object Generations.
HPROF Memory Snapshot
If the profiler is used to capture a memory snapshot in HPROF format, no object generation or object allocation information will be available.
Shallow and Retained Size
Shallow Size
The shallow size of an object is the amount of memory allocated to store the object itself, and not taking into account its referenced objects. The shallow size of a non-array object depends on the number and type of its fields. The shallow size of an array depends on the array length and the type of its elements, whether they are other objects or primitive types.
The shallow size of a set of objects represents the sum of the shallow sizes of all objects in the set.
Retained Size
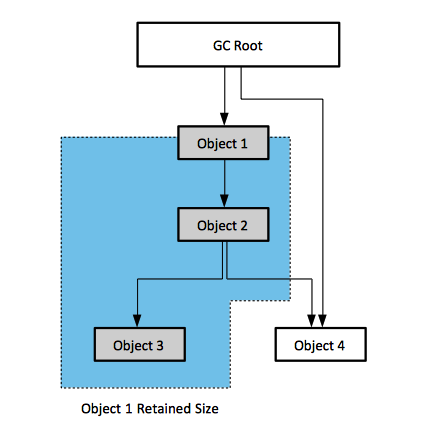
The retained size of an object is the object's shallow size plus the shallow size of the objects that are accessible, directly or indirectly, only from this object. The "only" specification is important, because, due to this constraint, the retained size represents the memory that would be freed by the garbage collector if that specific object is cleared. To measure the retained size, the objects in memory are considered to be nodes of a graph, where the edges represent references between objects. The graph has special nodes that cannot be referred by any object: these are the GC roots. For the case represented below, the retained size of Object 1 includes the shallow size of Object 1, Object 2 and Object 3, but not Object 4, because Object 4 can be accessed directly from a GC Root and it won't be collected if Object 1 is removed.
Retained size is a measure that helps understanding the structure (clustering) of memory and dependencies between object subgraphs.
Paths
YourKit is capable of calculating paths between objects in memory. A path between Object 1 and Object n is a sequence of objects where first element is Object 1, each element in the sequence, starting with the second one, is referenced from its predecessor, and the last element is Object n. Paths are useful when investigating memory leaks: a leak candidate must have a path to one or more GC Roots.
Ignore Selected Reference
"Ignore Selected Reference" is a feature that can be useful when working with paths from GC Roots: it immediately shows whether nulling a particular reference eliminates the leak, and, if not, which remaining reference should be considered.
Paths Between Predefined Sets
TODO: https://www.yourkit.com/docs/java/help/paths.jsp
Merged Paths
TODO: https://www.yourkit.com/docs/java/help/merged_paths.jsp
Object Generations
An object generation is a piece of information the profiler associates with an object, when the object is allocated on the heap. The "generation number" can be advanced arbitrarily by the user, or automatically incremented in case of certain events, such as a memory snapshot. Generations distribute objects by the time of their creation and are thus very helpful in finding memory leaks and performing other analyses on how the heap content evolves over time. When the profiler agent starts, the generation number is initialized to 1, and named "JVM initialization". The generation represents an object's age: the smaller the generation number, the older the object.
Memory Snapshots and Object Generations. When a memory snapshot is taken, the object generation number is first incremented, and all object instances enclosed by the snapshot automatically become part of the new generation:
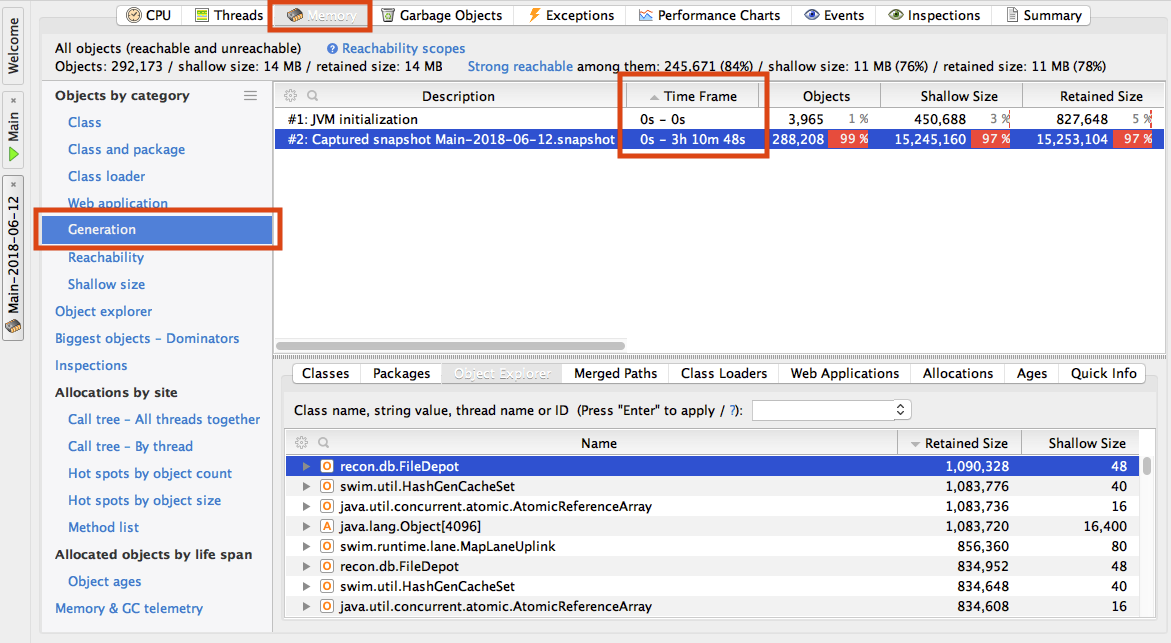
Object generation: #2: Captured snapshot Main-2018-06-12.snapshot (0s - 3 h 10 m 48s)
Arbitrary Object Generation Number Increment. The generation number can be arbitrarily increments from the Profiler UI, from the "Advance Object Generation Number" button or programmatically with an API call. When that happens, the object generation number is advanced and object created since that moment will belong to the new generation. This feature may be useful in identifying what object instances leak, without comparing two different memory snapshots: just one snapshot is sufficient, as the YourKit memory snapshot format retains the generation an objects was created in, across generations. Memory leak detection procedures are described here: Diagnosing a Memory Leak.
All objects separated by the time of their creation can be seen in Memory -> Generation. The upper window has a "Time Frame" column that shows the t0 - t1 timestamps, counted since the JVM started, that bound that generation:
A specific object's generation can be read from:
- Objecte explorer -> Quick Info Tab
- Objecte explorer -> Select -> Right Click -> Quick Info
Object Allocation Recording
Object allocation recording consists in tracking and recording the method calls where objects are created. Object allocation recording is also known as "allocation telemetry". Allocation recording is based on byte code instrumentation but by default, object allocation recording is not enabled, as the operation may have performance implications. When the allocation recording is not enabled, there is almost no overhead, even if the bytecode instrumentation is present. Bytecode instrumentation may be eliminated with "disablealloc" and "disableall" startup options. When object allocation recording is enabled, the "Object Allocation Recording" graph in the "Memory" tab shows the number of objects created per second. Object allocation can be recorded in two modes recording of the thread and stack where objects are allocated (default) and object counting mode.
Recording of the thread and stack where objects are allocated provides most detail about object allocation, but it also comes with the highest overhead. The full stack and thread where a particular object is created is determined and remembered in the memory snapshot for each recorded object. The collection overhead can be kept under control if only a certain percentage of object allocation is recorded, skipping all others. It is also possible to configure the profiler to only record allocation of objects over a certain size. This options is configured in the "Reduce overhead by not recording all objects" section of the control UI.
It is also possible to use a sampling thread to obtain stacks of running threads, instead of recording the exact stack trace of reach recorded new object. Just like the case of CPU sampling, the sampled object allocation recording results are relevant only for methods that are longer than the sampling period. This mode require expert skills in interpreting the results. It is enabled in the "Estimated (sampled) stacks instead of exact stacks" in the control UI.
Object counting provides allocated object counts by class, then by immediate allocator method with the line number, if available. It does not provide stack traces, and does not track particular instances. Object allocated in different threads are summed and they cannot distinguished. Counts are not guaranteed to be exact. To ensure minimal overhead, allocation counters are updated without taking any locks or using test-and-set style atomic operations. If the same method running in parallel in different threads running on different CPU cores simultaneously create instance of the same class, some of them may be missed by a non-atomic counter. Object counting mode has the lowest (almost zero) overhead of these two methods.
Recorded allocations are shown in the "Allocations" view of the "Memory Tab".
Object Reachability
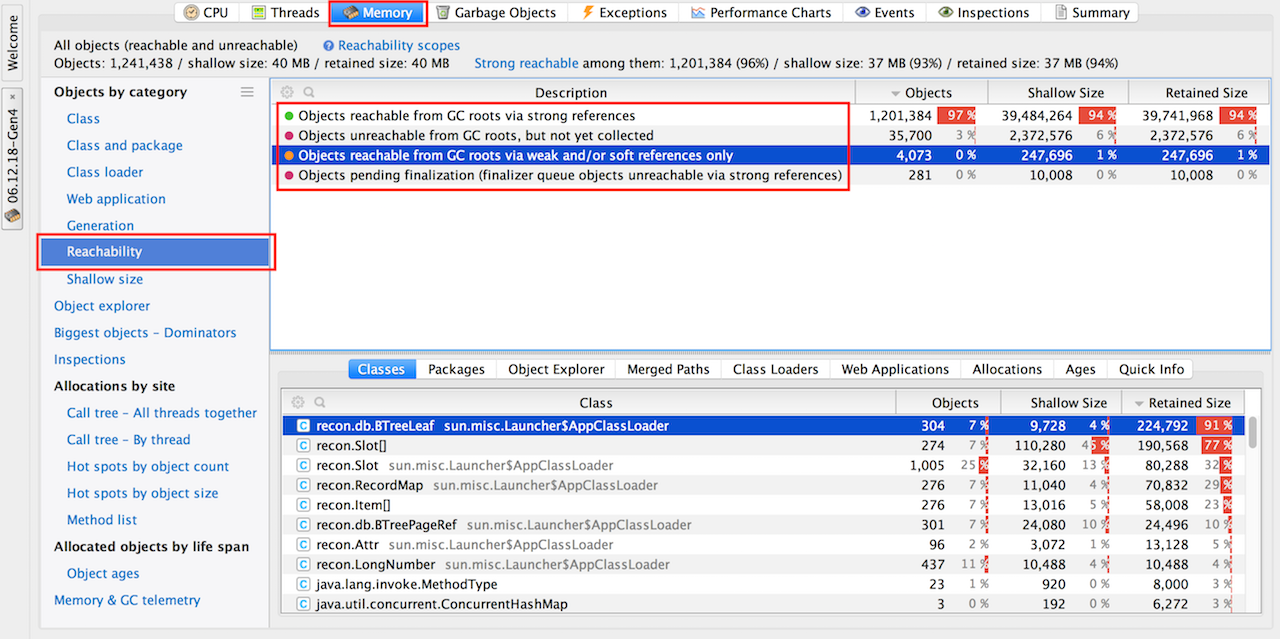
The profiler has a dedicated "Reachability" memory snapshot view. It shows object within their reachability scopes, distributed according to how/whether they are reachable from GC roots:
- Objects reachable from GC roots via strong references.
- Objects unreachable from GC roots, but not yet collected.
- Objects reachable from GC roots via weak and/or soft references only.
- Object pending finalization (finalizer queue objects unreachable via strong references).
Dominators
The memory tab has a specialized view ("Biggest object - Dominators") that show individual objects that retain most of memory. The objects are shown in a "dominator tree": if object A retains object B, then object B will be nested in object A's node.
Outgoing References View
Incoming References View
Memory Inspections
An "inspection" is a type of automatic, high-level analysis of the application memory. Each inspection automatically detects a specific (and usual) memory issue.
Automated Memory Snapshot Trigger
Set Description Language
An XML-based language that provides the ability to specify sets of objects in a declarative way. It can be used, for example, to examine memory distribution in automated memory tests.
TODO, to explore: https://www.yourkit.com/docs/java/help/language.jsp
Profiler API
TODO: https://www.yourkit.com/docs/java/help/api.jsp
To Process
To Process:
- http://localhost:9627/personal/Wiki.jsp?page=YourKitConcepts
- http://localhost:9627/personal/Wiki.jsp?page=YourKitToDistribute


