YourKit Operations
Internal
Logging
The log files are created in ~/.yjp/log.
Diagnosing a Memory Leak
A memory leak represents an unwanted accumulation of object instances on the heap. Memory leak diagnosis consists of:
- determining there is a memory leak
- identifying the object instances that leak
- identifying the reason the leaked object instances are held in memory
For concepts used in memory leak diagnosis, see Java Memory Concepts and YourKit Concepts for Memory Profiling.
Memory Leak Symptoms
The most obvious symptom of a memory leak is the continuous increase in the old generation footprint, after successive full garbage collections. This behavior can be determined by analyzing the garbage collection logs, and it is visible in the form of a monotonously increasing occupancy level. Full garbage collections can be forced from the profiler UI. Most OutOfMemoryErrors (but not all of them) are also an indication of memory leak.
Identifying Object Instances that Leak
The essence of the procedure is to capture two memory snapshots at two different moments in time, t0 and t1, sufficiently far apart so the state of the heap captured at the moment t1 includes object instances that are part of the leak. If HPROF memory snapshots are captured, the differential analysis may offer hints on what object instances may be included in the leak. However, if YourKit memory snapshot format is used, object generation information included in these snapshots may help identifying the leaked objects with more precision.
1. Take a memory snapshot at time t0. If the memory snapshot is taken while the target JVM is instrumented with the YourKit profiler agent, the object generation information is automatically incremented right before the snapshot to G0, so all the object instances included by the snapshot will belong to generation G0.
2. Let the application perform the task suspected of generating memory leak, or leave the application to run for a sufficiently long time to generate leaked instances.
3. Take a memory snapshot at time t1. For YourKit memory snapshots, the object generation information will be automatically incremented to G1.
4. Use the YourKit Profiler UI to load the t0 and t1 snapshots: File -> Open Snapshot.
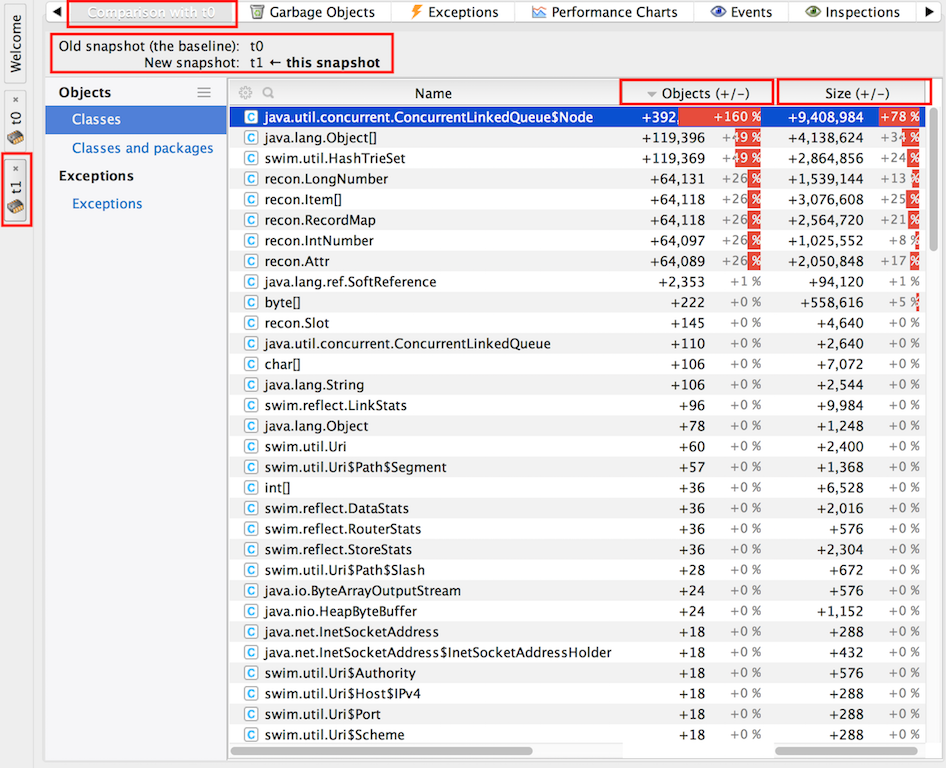
5. Right click on t1 snapshot tab and "Compare Snapshot with ... " -> t0.
6. Select only "Strong reachable" reachability scope.
"Objects (+/-)" displays the difference in object count for instances of the specified class. A positive value means that snapshot t1 (the later memory state) has more objects than t0. "Size (+/-)" displays the difference in shallow size associated with the specified class instances. A positive value means that the corresponding instances in t1 snapshot (the later memory state) have a larger shallow memory footprint. The percentage associated with the change in size is calculated relative to the total size of all objects in the old snapshot: 100% of size corresponds to the total size of all objects in the old snapshot.
According to YourKit forums (can't find instances from memory compare) snapshot comparison does not show instances present in deltas, it only shows aggregate statistics by class. In case a growth in the count of instances of a specific type is noticed between two successive heap dump, it is unfortunately not possible to select individual objects that contributed to the growth and "lived" from a memory snapshot to another, to track their roots to a GC root. This is because we cannot keep track of individual object identity across memory snapshots. A Java object does not have persisting ID in the heap. An object reference is actually an object physical address, it may change when the garbage collector compacts the heap or moves objects between heap generations. More subtly, if there's a growth in numbers of instances of a certain class, it does not necessarily mean that some instances survived from a snapshot to another, it may possibly mean that all instances of that type have been garbage collected, and more, in an absolute number, have been created. To identify which particular object of a certain class has leaked, object generations should be used, as described below.
7. Employ heuristics to identify the most likely source of leaks (there could be more than one independent leaks). Pick a class whose instances are most likely to cause the leak.
8. Go to the new snapshot (t1)
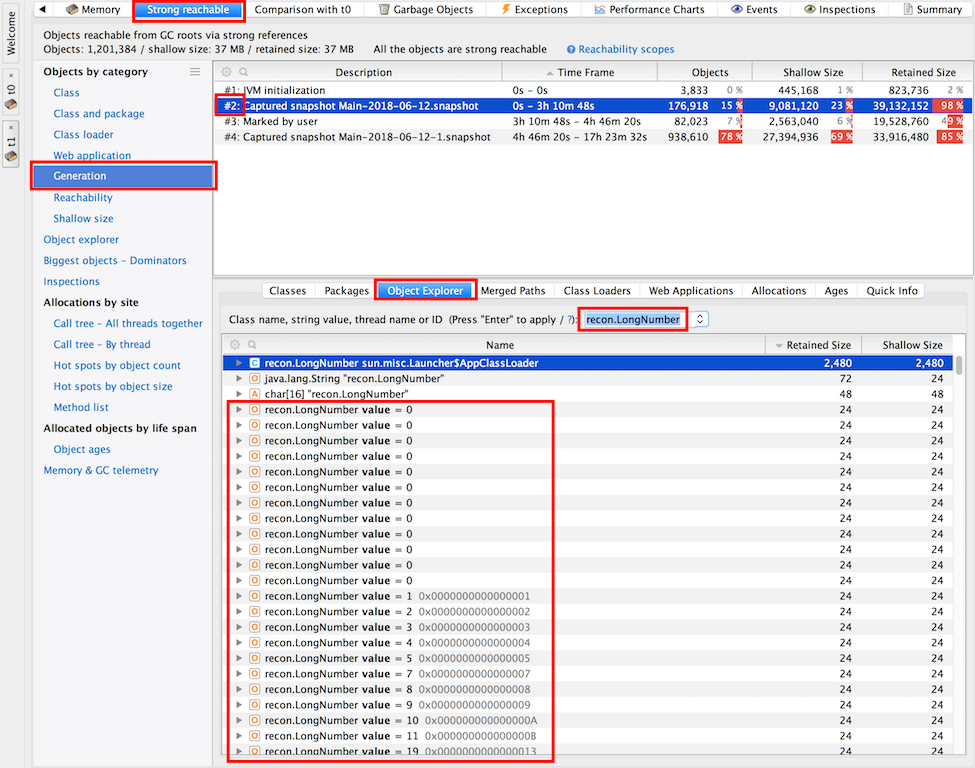
9. Select "Strong reachable" in the header.
10. Go to Generations and select generation G0 -> Object Explorer in the lower window -> Filter by the suspect class name. The query will return instances of the class that survived on the heap since the first snapshot, and they are most likely to cause the leak.
11. Select a suspect object instance -> Right Click -> Selected Objects
12. "Paths from GC Roots" tab -> Calculate paths. This will calculate paths from GC Roots to this object.
13. Apply application logic knowledge to decide whether the instance is a leak or not.
Use "Ignore Selected References" -> that is equivalent with "garbage collecting" the object holding the reference".
14. Factor in dominators.
Memory Snapshot Exploration
In the header, select "Strong reachable".
In the "Class" view, order the classes in the descending order of the "Retained Size".
Start with the classes listed at the top.
For the top-most class, click on it to select it, then click on "Object Explorer" tab. Alternatively Right-Click -> Selected Objects.
Order the "Object Explorer" list in the descending order of the Retained Size.
For the largest instance, right click -> Paths from GC Roots
Determine the CG roots holding onto it and try to understand application's behavior that led to that configuration.
Go over GC root paths one by one and use "Ignore Selected References".
Continue for the next instances.
Diagnosing Elevated Steady State Memory Level
This procedure can be used in diagnosing elevated steady state memory level. TODO.
Diagnosing Excessive Garbage Collection
For concepts used in diagnosing excessive garbage collection, see YourKit Concepts for Memory Profiling.
Procedure:
Manually Configure Target JVM for Remote Profiling
Connect to a Remote Instrumented JVM via SSH
Before attempting to connect, the remote JVM should be instrumented as described in Manually Configure Target JVM for Remote Profiling.
Profile remote Java EE server or application ... -> Main Tab
Connection name: usually named after the host name.
Host IP or address: Address of the machine where Java processes run.
Application discovery method -> Advanced -> SSH user.
For "Authentication settings" the password or the private key can be used.
The connection can then be tested with "Test Connection".
Connect to a Remote Instrumented JVM via an SSH Tunnel
TODO.
Maven and YourKit
TODO: http://localhost:9627/personal/Wiki.jsp?page=MavenAndYourKit
CPU Profiling and Identifying Hot Spots
TODO: http://localhost:9627/personal/Wiki.jsp?page=YourKitCPUProfiling
Stack Telemetry
TODO: http://localhost:9627/personal/Wiki.jsp?page=YourKitStackTelemetry

