Pandas Series
External
- https://pandas.pydata.org/docs/user_guide/dsintro.html#series
- https://pandas.pydata.org/docs/reference/api/pandas.Series.html#pandas.Series
- https://www.geeksforgeeks.org/python-pandas-series/
Internal
Overview
A Series is a one-dimensional array of values, where each value has a label. The labels are referred to as "axis labels" and they are managed by the series's index. By default, in absence of any explicit specification, a series gets a monotonic integer range index, starting with 0 and with the step 1, allowing retrieving data with 0-based integer indexes (see Accessing Elements of a Series below).
Every series has a name and a data type, which are both reported when the series is printed.
A Series is implemented with a NumPy ndarray.
Axis
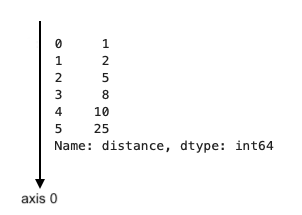
The Series has just one axis, "axis 0", which is aligned alongside the Series values, pointing "downwards":
The Series axes property gives access to a one-element array containing the Series's Index:
assert len(s.axes) == 1
print(s.axes)
[RangeIndex(start=0, stop=6, step=1)]
Index
Also see:
RangeIndex
Time Series Index
An index that contains datetime turns the A time series is a series whose index has datetime objects. To create a time series, ensure that the method that creates the series performs the conversion automatically, as show in the Create a Time Series from CSV section.
Name
A series has a name, accessible with .name.
Investigate a Series
The total number of elements of a series, also known as its size or length can be obtained with the Series' size attribute, which returns the same value as the Python len() function applied to the series:
size = s.size
same_size = len(s)
assert size == same_size
Number of elements:
The value of the first index:
The value of the last index:
Create a Series
Create a Series Programmatically
A series can be created from an in-memory list:
import pandas as pd

a = ['a', 'b', 'c']
s = pd.Series(a)
A series can also be created from data stored externally.
From a DataFrame
Create a Series from CSV
Create a Time Series from CSV
Create a Series from JSON
Parse: https://pandas.pydata.org/docs/reference/api/pandas.read_json.html#pandas.read_json
Also see:
Accessing Elements of a Series
This is known as indexing or subset selection.
The Index Operator [...]
Do not attempt to access an element using the indexing operator [] and a integral index. It may work, but the usage has been deprecated, use iloc instead.
iloc[]
Access using integral coordinates.
s.iloc[0]
loc[]
Access using index values. Reconcile
s.loc[0]
s.loc['2023-10-10']
index[]
Access using index values.
s.index[0]
Operations on Series
Filtering
Index for Condition
Return the index values for which the series values meet a certain condition:
s.index[<condition>]
s.index[s == 0]
Will return:
DatetimeIndex(['2008-04-06', '2008-05-04', '2008-06-07', '2008-07-05',
               '2008-08-16', '2008-09-06', '2008-09-20', '2008-10-12',
               '2012-04-12'],
              dtype='datetime64[ns]', name='Date', freq=None)
Dropping Values
Keep only the elements whose values make the expression evaluate to true:
s = s[<expression>]
Drop all zero values:
s = ...
s = s[s != 0]
Extract Values Between Certain Index Limits
loc[]
For a time series, use loc[] to apply a slice to the index values.
s = s.loc['2023-09-17':'2023-10-05']
s = s.loc['2023-09-17':]
Transformation
This class of operations are referred to as transformations or conversions.
apply()
Each element of the series can be transformed by applying the function specified as argument to apply().
The function can a named function or a lambda.
Note that apply() will not convert the elements in-place, it will create a new series instead.
apply() a Named Function
For example, if the elements of the series are dollar values in the format "$1,234", to convert them to integers, use:
s = ...
def convert_dollar_str_to_int(s: str):
    return int(s[1:].replace(',',''))
s = s.apply(convert_dollar_str_to_int)
apply() a Lambda
s = ...
s.apply(lambda x: x * 1.1)
Interpolation
Binary Operations with Series
TO PROCESS: https://www.geeksforgeeks.org/python-pandas-series/ The series must be identically sampled:
sp500_perc_diff = fid_slf.sub(sp500_perf).div(sp500_perf).mul(100)
