Pandas DataFrame: Difference between revisions
(→Shape) |
|||
| (61 intermediate revisions by the same user not shown) | |||
| Line 5: | Line 5: | ||
=Internal= | =Internal= | ||
* [[Pandas_Concepts#DataFrame|Pandas Concepts]] | * [[Pandas_Concepts#DataFrame|Pandas Concepts]] | ||
* [[ | * [[Pandas_Series|Series]] | ||
=Overview= | =Overview= | ||
A DataFrame is a two-dimensional data structure with columns of potentially different types. | A DataFrame is a two-dimensional data structure with columns of potentially different types and rows. A useful mental model for a DataFrame is a a dict-like container for [[Pandas_Series#Overview|Series]] objects, where each column is a [[Pandas_Series#Overview|Series]]. Some times, documentation refers to columns as "features" or "variables". The values stored in rows are referred to as "records". DataFrame provides both row and column labels. | ||
=Axes= | |||
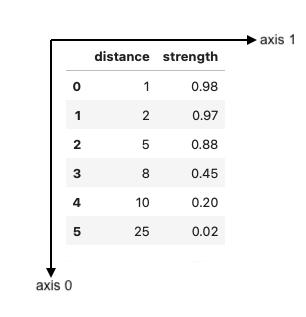
The DataFrame has two [[Pandas_Concepts#Axis|axes]]: "axis 0" which is aligned alongside the DataFrame's rows pointing "downwards", representing rows, and "axis 1", which is aligned alongside the column headers, pointing from left to right, representing columns: | |||
:::[[File:Panda_DataFrame_Axes.png]] | |||
A DataFrame shares the same direction for "axis 0" with its Series' [[Pandas_Series#Axis|axes]]. | |||
The DataFrame <code>axes</code> property gives access to an array containing two [[Pandas_Concepts#Index|Index]] instances, the first for the rows, the second one for the columns: | |||
<syntaxhighlight lang='py'> | |||
assert len(df.axes) == 2 | |||
print(df.axes) | |||
</syntaxhighlight> | |||
<font size=-1> | |||
[RangeIndex(start=0, stop=6, step=1), Index(['distance', 'strength'], dtype='object')] | |||
</font> | |||
=Shape= | =Shape= | ||
The DataFrame <code>shape</code> property contains a tuple that returns the dimensionality of the DataFrame: (rows, columns). | |||
=Index= | |||
By default, the DataFrame gets a [[Pandas_Concepts#RangeIndex|RangeIndex]]. | |||
The index of the DataFrame can be accessed with the <code>index</code> property: | |||
<syntaxhighlight lang='py'> | |||
df = pd.DataFrame(...) | |||
df.index | |||
</syntaxhighlight> | |||
However, the index of the DataFrame can be replaced with <code>set_index()</code>. | |||
<font color=darkkhaki>A DataFrame seems to have a horizontal axis index, shown below, but it is not clear how it can be used:</font> | |||
<syntaxhighlight lang='py'> | |||
Index(['distance', 'strength'], dtype='object') | |||
</syntaxhighlight> | |||
Also see: {{Internal|Pandas_Concepts#Index|Pandas Concepts | Index}} | |||
==<tt>set_index()</tt>== | |||
<code>set_index(<column-name>)</code> function replaces the DataFrame's index with the column whose name is specified as argument: | |||
<syntaxhighlight lang='py'> | |||
df2 = df.set_index('date') | |||
</syntaxhighlight> | |||
Setting the index to a column, ("date" column in this case) changes the DataFrame dimensionality, it reduces the number of column with one, as the "date" column will be used as index. Also, the index replacement takes place for a newly created DataFrame, returned as the result of the function. To perform an in-place replacement, use <code>inplace=True</code> and <code>drop=True</code> as arguments. For more details, see {{Internal|Pandas_DataFrame#set_index.28.29|DataFrame | <tt>set_index()</tt>}} | |||
=Create a DataFrame= | =Create a DataFrame= | ||
==Create a Data Frame Programmatically== | |||
<syntaxhighlight lang='py'> | |||
import pandas as pd | |||
df = pd.DataFrame({ | |||
'distance': [1, 2, 5, 8, 10, 25], | |||
'strength': [0.98, 0.97, 0.88, 0.45, 0.20, 0.02] | |||
}) | |||
</syntaxhighlight> | |||
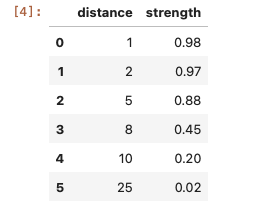
<span id='example'></span>Shows up as: | |||
:::[[File:Panda_DataFrame.png|254px]] | |||
==Create a DataFrame from a CSV File== | ==Create a DataFrame from a CSV File== | ||
<syntaxhighlight lang='py'> | |||
import pandas as pd | |||
df = pd.read_csv("./analysis.csv") | |||
</syntaxhighlight> | |||
If the CSV file contains column that need to be handled as time series, see: {{Internal|Time_Series_Processing_with_Pandas#Load_a_Time_Series|Load a Time Series}} | |||
=Accessing Elements of a DataFrame= | =Accessing Elements of a DataFrame= | ||
==Accessing a Column== | |||
An individual column can be accessed with the <code>[]</code> operator, by specifying the column column name. The result is a [[Pandas_Series|Series]]: | |||
<syntaxhighlight lang='py'> | |||
df = ... | |||
df['Date'] | |||
type(df['Date']) # displays pandas.core.series.Series | |||
</syntaxhighlight> | |||
==<tt>iloc[]</tt>== | |||
A property that allows integer-based access (indexing). The location is specified as a 0-based index position. The property accepts a wide variety of arguments. | |||
===<tt>iloc[0_based_row_index, 0_based_column_index]</tt>=== | |||
<code>iloc[0_based_row_index, 0_based_column_index]</code>. For the example [[#example|above]], <code>df.iloc[0,0]</code> would return 1, <code>df.iloc[1,0]</code> would return 2 and <code>df.iloc[0, 1]</code> would return 0.98. | |||
===<span id='Extract_a_Series_from_the_DataFrame'></span><tt>iloc[:, 0_based_column_index]</tt>=== | |||
Extract the entire series corresponding to the provided 0-based column index: | |||
<syntaxhighlight lang='py'> | |||
df = ... | |||
# extract a series corresponding to DataFrame column 0 | |||
s = df.iloc[:,0] | |||
</syntaxhighlight> | |||
===<tt>iloc[idx0:idx1, 0_based_column_index]</tt>=== | |||
Use the slice expression to extract a series subset, also as a series: | |||
Extract the entire series corresponding to the provided 0-based column index: | |||
<syntaxhighlight lang='py'> | |||
df = ... | |||
s = df.iloc[1:2,0] | |||
</syntaxhighlight> | |||
==<tt>loc[]</tt>== | |||
A property that allows label-based access (indexing). | |||
==<tt>squeeze()</tt>== | |||
==<tt>[]</tt>== | |||
=Operations on DataFrames= | =Operations on DataFrames= | ||
==Filtering== | |||
To filter DataFrame rows based on the values of the index, use <code>loc[<index_condition>, <column_specification>]</code>. | |||
The index condition is similar to: | |||
<syntaxhighlight lang='py'> | |||
df2 = df.loc[df.index >= '2023-06-01', :] | |||
</syntaxhighlight> | |||
This applies to a timeseries, filtering by date and returning all columns. To return a specific column, as a Series: | |||
<syntaxhighlight lang='py'> | |||
s = df.loc[df.index >= '2023-06-01', 'some_column'] | |||
</syntaxhighlight> | |||
Latest revision as of 23:26, 14 May 2024
External
- https://pandas.pydata.org/docs/user_guide/dsintro.html#dataframe
- https://pandas.pydata.org/docs/reference/api/pandas.DataFrame.html#pandas.DataFrame
Internal
Overview
A DataFrame is a two-dimensional data structure with columns of potentially different types and rows. A useful mental model for a DataFrame is a a dict-like container for Series objects, where each column is a Series. Some times, documentation refers to columns as "features" or "variables". The values stored in rows are referred to as "records". DataFrame provides both row and column labels.
Axes
The DataFrame has two axes: "axis 0" which is aligned alongside the DataFrame's rows pointing "downwards", representing rows, and "axis 1", which is aligned alongside the column headers, pointing from left to right, representing columns:
A DataFrame shares the same direction for "axis 0" with its Series' axes.
The DataFrame axes property gives access to an array containing two Index instances, the first for the rows, the second one for the columns:
assert len(df.axes) == 2
print(df.axes)
[RangeIndex(start=0, stop=6, step=1), Index(['distance', 'strength'], dtype='object')]
Shape
The DataFrame shape property contains a tuple that returns the dimensionality of the DataFrame: (rows, columns).
Index
By default, the DataFrame gets a RangeIndex.
The index of the DataFrame can be accessed with the index property:
df = pd.DataFrame(...)
df.index
However, the index of the DataFrame can be replaced with set_index().
A DataFrame seems to have a horizontal axis index, shown below, but it is not clear how it can be used:
Index(['distance', 'strength'], dtype='object')
Also see:
set_index()
set_index(<column-name>) function replaces the DataFrame's index with the column whose name is specified as argument:
df2 = df.set_index('date')
Setting the index to a column, ("date" column in this case) changes the DataFrame dimensionality, it reduces the number of column with one, as the "date" column will be used as index. Also, the index replacement takes place for a newly created DataFrame, returned as the result of the function. To perform an in-place replacement, use inplace=True and drop=True as arguments. For more details, see
Create a DataFrame
Create a Data Frame Programmatically
import pandas as pd
df = pd.DataFrame({
    'distance': [1, 2, 5, 8, 10, 25],
    'strength': [0.98, 0.97, 0.88, 0.45, 0.20, 0.02]
})
Shows up as:
Create a DataFrame from a CSV File
import pandas as pd
df = pd.read_csv("./analysis.csv")
If the CSV file contains column that need to be handled as time series, see:
Accessing Elements of a DataFrame
Accessing a Column
An individual column can be accessed with the [] operator, by specifying the column column name. The result is a Series:
df = ...
df['Date']
type(df['Date']) # displays pandas.core.series.Series
iloc[]
A property that allows integer-based access (indexing). The location is specified as a 0-based index position. The property accepts a wide variety of arguments.
iloc[0_based_row_index, 0_based_column_index]
iloc[0_based_row_index, 0_based_column_index]. For the example above, df.iloc[0,0] would return 1, df.iloc[1,0] would return 2 and df.iloc[0, 1] would return 0.98.
iloc[:, 0_based_column_index]
Extract the entire series corresponding to the provided 0-based column index:
df = ...
# extract a series corresponding to DataFrame column 0
s = df.iloc[:,0]
iloc[idx0:idx1, 0_based_column_index]
Use the slice expression to extract a series subset, also as a series: Extract the entire series corresponding to the provided 0-based column index:
df = ...
s = df.iloc[1:2,0]
loc[]
A property that allows label-based access (indexing).
squeeze()
[]
Operations on DataFrames
Filtering
To filter DataFrame rows based on the values of the index, use loc[<index_condition>, <column_specification>].
The index condition is similar to:
df2 = df.loc[df.index >= '2023-06-01', :]
This applies to a timeseries, filtering by date and returning all columns. To return a specific column, as a Series:
s = df.loc[df.index >= '2023-06-01', 'some_column']

